Amazon Episode 1:
Harnessing the power of reviews for data marketing strategy
When it comes to online marketplaces, it pays to listen to the little guy.
Indeed, the best brand ambassadors are still undoubtedly users themselves. The proof? 79% of customers trust online opinions as much as a personal recommendation, making these reviews a powerful tool for marketing and data teams — so long as the right monitoring indicators are selected, of course.
Are you specialised in product development?
Reviews are trend indicators: analysing product reviews from an innovative range by a competitive brand allows you to understand exactly what users like and dislike. Openly available to the public, this information — if analysed correctly — can become crucial input for R&D teams.
Are you specialised in data and product marketing?
Reviews reflect customer opinions: existing customers’ questions and reviews help you to better understand both the requirements intrinsically linked to the product as well as common issues that emerge. Reorganising product sheets to further enhance the value of certain key information will encourage customers to leave more detailed reviews.
So without further ado, here are five key indicators, along with an interactive dashboard, to help you navigate the jungle that is online reviews to your maximum benefit!
5 key performance indicators to monitor on Amazon:
1. Average rating
The average rating isn’t actually a true mathematical average, as Amazon takes into account several factors, including a review’s age, helpfulness rating and whether or not it features at least one verified purchase. Nevertheless, it remains a good indicator for future sales as it influences new customers’ purchases.
What are the KPIs? Analysing all similar products from your brand and competitors includes calculating their average and monitoring their evolution over time.

2. Volume and relevancy
A study by BrightLocal showed that 44% of respondents evaluated the number of reviews collected by a company on a website. At the same time, a study by Trustpilot revealed that 16% of customers consider reviews irrelevant after just 3 months, 36% after 6 months and 65% after one year.
What are the KPIs? High-volume comments do not equal a high-quality product. The important thing is to ensure that reviews are updated regularly.
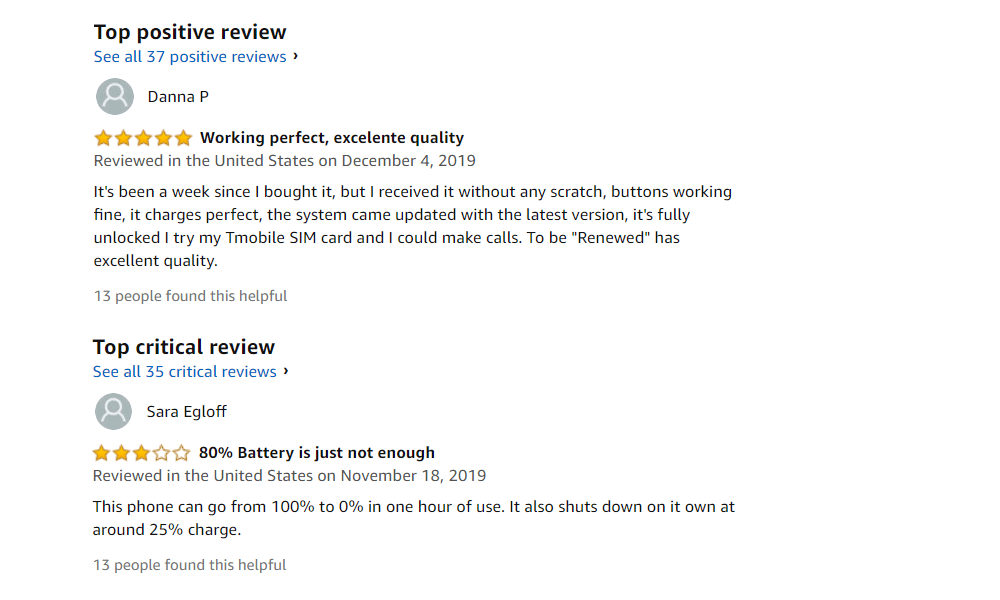
3. Most useful comments
While quantity is important, quality should not be underestimated. Potential buyers read the content of comments with avid interest. Amazon even offers them the opportunity to evaluate the relevance of a comment by clicking the “Helpful” button (to be integrated).
What are the KPIs? While Amazon collects ‘helpfulness’ data in order to provide the most relevant comments to its users, be advised that the most useful comments can be both positive and negative.
4. Customer perception
Sentiment analysis, one of the focuses of Natural Language Processing (NLP), attempts to identify and extract opinions from a text. In addition to identifying the opinion, these systems usually extract the main features of the review being studied, for example:
- Polarity: whether the person expresses a positive or negative opinion
- The subject: what is being discussed
- The opinion holder: the person or entity expressing the opinion
What are the KPIs? By analysing the feelings conveyed by reviews, it is possible to attribute a more or less positive perception of each of your products and establish a list of actions to address any problems encountered.

5. Most frequent subjects
Analysing key content words in comments allows you to identify recurring themes of discussion about your products. Studying these topics is extremely useful to show what aspects of the product are of interest to customers or, conversely, what has caused any dissatisfaction.
What are the KPIs? By combining these themes with sentiment analysis algorithms, it is possible to ascertain whether each subject is discussed positively or negatively. In other words, what are customers’ expectations and where do products fall short?
Explore this data via an automatic dashboard
With these five KPIs in hand, you’re ready to begin analysing the comments your customers leave on Amazon to understand their expectations, pinpoint areas for improvement and track your competitors’ performance in turn. For more information, check out our example of an interactive dashboard below. Created using Amazon data from Apple products, it invites you to explore all of the data in a playful and dynamic way. If you like it, we can customise a similar interactive dashboard for your brand.
Like any major online marketplace, Amazon is a key issue that can’t be left by the wayside. This article is the first chapter in our special report dedicated to the online giant. For more information, please get in touch—our Digital Consulting team will be delighted to assist you with any and everything Amazon.
Subscribe FOR NEWS
Join Our Newsletter
Stay up to date with digital, technological and cultural insights!
2019 @ Datawords Group – View the terms – All Rights Reserved